A driver runs through a scale in Georgia, gets written up for a brake adjustment on a trailer he picked up loaded that morning, and pays a $150 fine. Eighteen months later the carrier is paying four figures more a year in premium and cannot work out why three brokers stopped offering loads.
Your CSA score follows you into every insurance renewal and every broker onboarding packet. It decides how often you get pulled onto the scale. Most carriers have never seen how the number is built, which is why the first real look at it usually happens too late to do anything about.
Here is what the score is, how the points are actually calculated, how to look yours up, and what moves it.
What a CSA Score Is, in Plain Terms
CSA stands for Compliance, Safety, Accountability. It is FMCSA's program for measuring how safely a carrier operates, and it runs on data you generate every time you cross a scale.
The chain works like this:
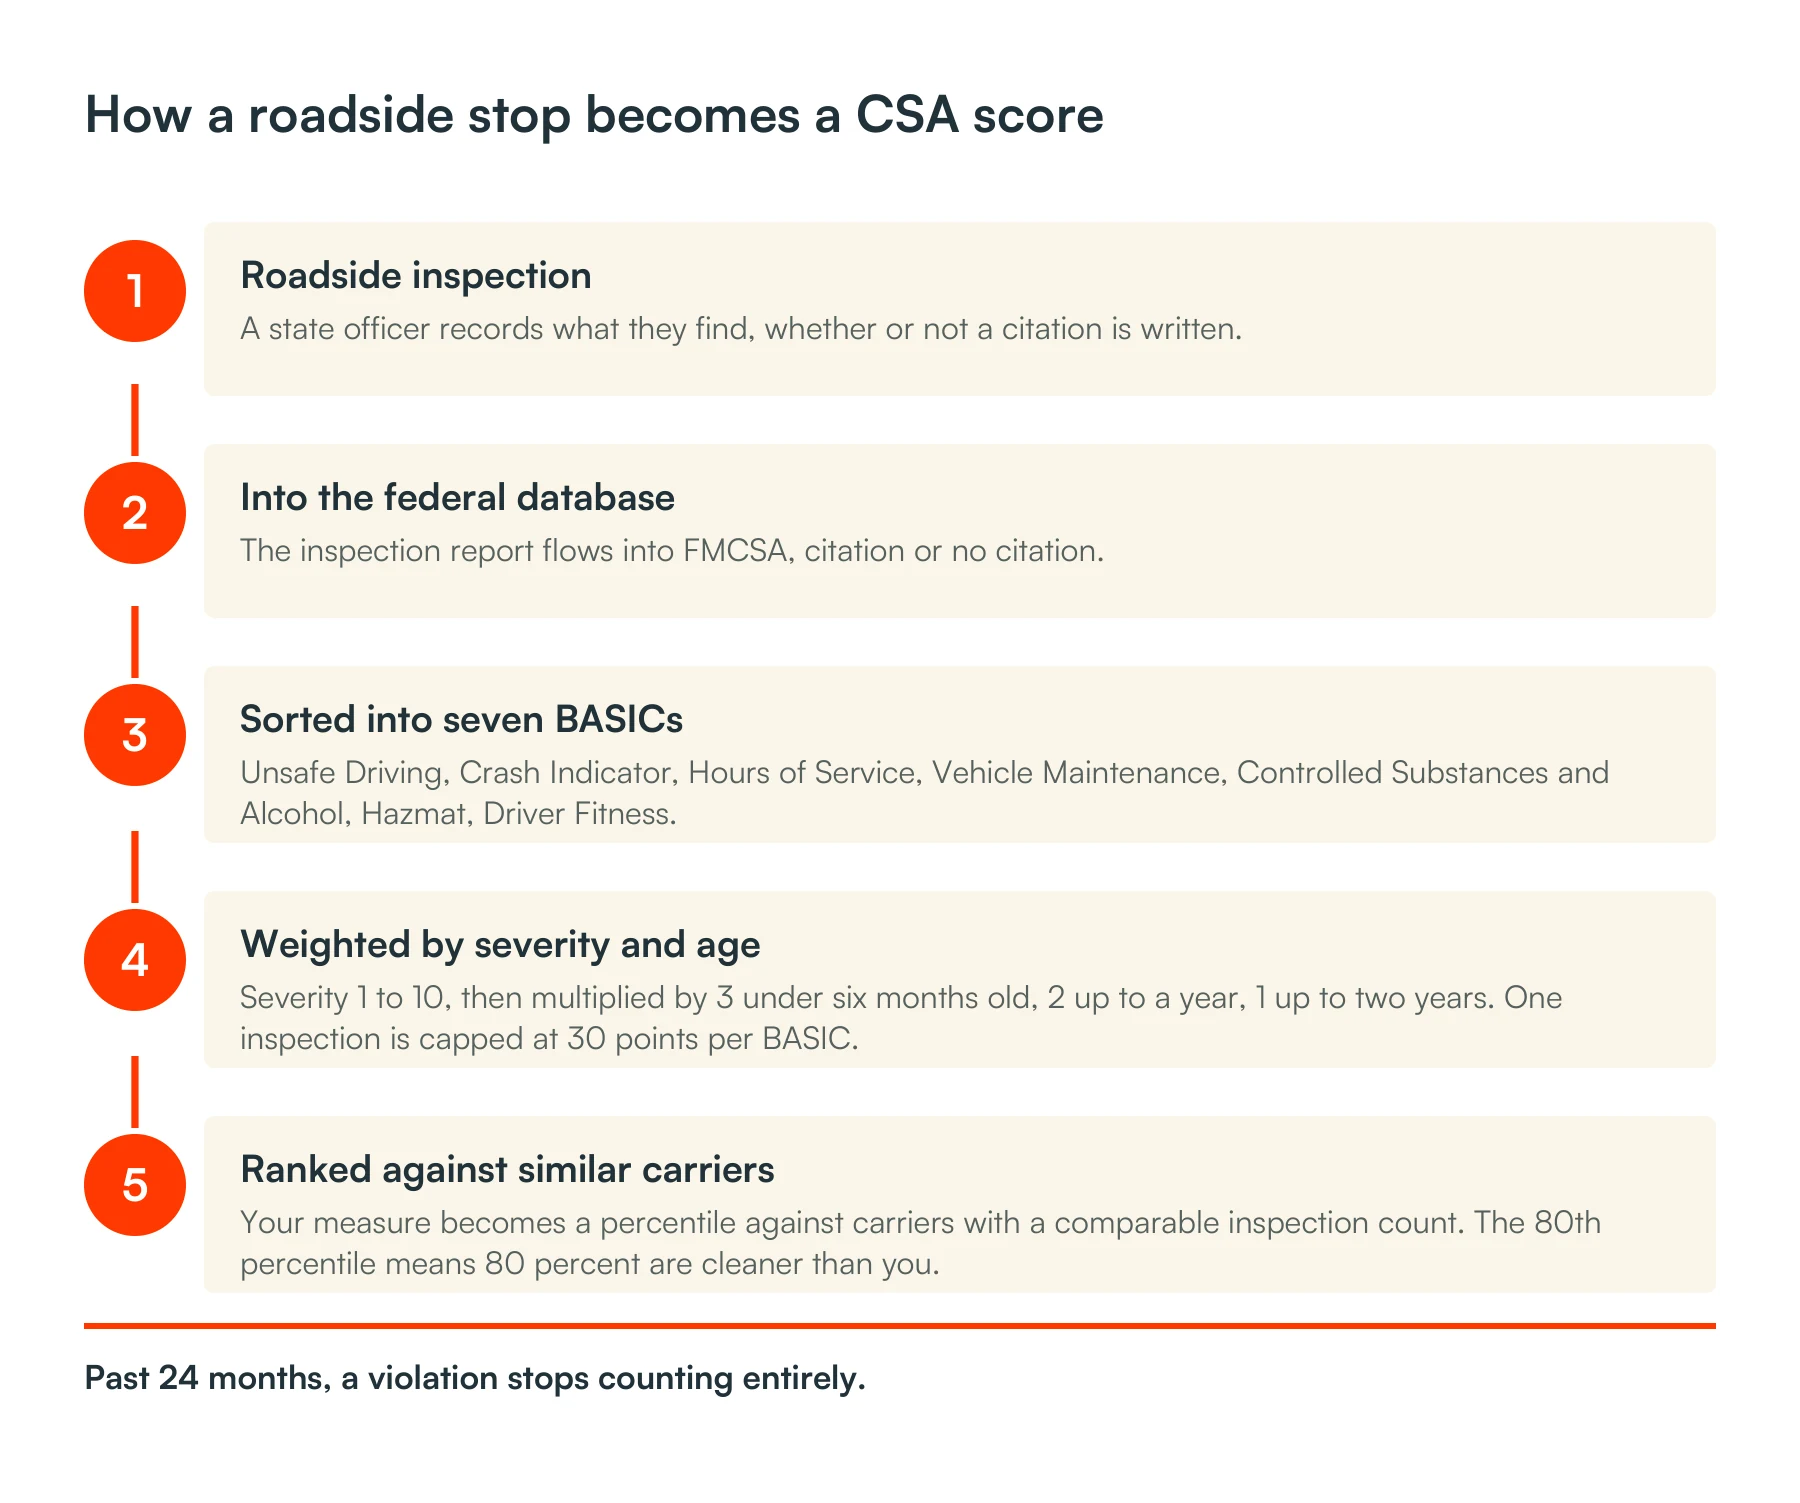
- A state officer performs a roadside inspection and records what they find.
- That record flows into FMCSA's database, whether or not a citation was written.
- The Safety Measurement System, or SMS, processes those records into scores across seven categories called BASICs: Unsafe Driving, Crash Indicator, Hours-of-Service Compliance, Vehicle Maintenance, Controlled Substances and Alcohol, Hazardous Materials Compliance, and Driver Fitness.
- Each violation carries a severity weight, and that weight is multiplied by a time weight. A violation from the last six months counts triple, one recorded over six and up to twelve months ago counts double, one older than twelve but inside twenty-four months counts once. Past 24 months it is no longer used at all (FMCSA, SMS Methodology, BASIC Prioritization Status Version 3.21, June 2026).
- Your scores get compared against carriers with a similar inspection volume, producing a percentile ranking.
The percentile is the part that matters. A score in the 80th percentile does not mean you passed with an 80. It means 80 percent of comparable carriers have a cleaner record than you do in that category.
Why a Violation Costs More Than the Fine
The fine is the cheapest part of a bad inspection. The expensive parts arrive later and keep arriving.
Insurance premiums. Underwriters pull CSA data directly. Deterioration in Unsafe Driving or Vehicle Maintenance shows up at renewal as a higher number, and it stays high for as long as the violations stay weighted. That is the same data your truck insurance is priced off.
Broker access. Broker compliance platforms screen carriers automatically against CSA thresholds. A carrier flagged by that screen does not get a rejection email. The load never gets offered. You lose freight you never knew existed.
Inspection frequency. A high score puts you on the list. More inspections mean more chances for another violation, which raises the score further. The loop compounds in the wrong direction.
Enforcement attention. Sustained poor scores can trigger an FMCSA intervention, which escalates from a warning letter through to an onsite investigation. The thresholds are published, and they are not the same for every category.
| BASIC | General | Hazmat | Passenger |
|---|---|---|---|
| Unsafe Driving, Crash Indicator, HOS Compliance | 65% | 60% | 50% |
| Vehicle Maintenance, Controlled Substances/Alcohol, Driver Fitness | 80% | 75% | 65% |
| HM Compliance | 80% | 80% | 80% |
The first row is stricter because FMCSA's own analysis found those three have the strongest association with crash risk (FMCSA, SMS Methodology, BASIC Prioritization Status Version 3.21, June 2026).
For a single-truck operation, one incorrect violation sitting on the record for two years can quietly cost thousands in premium and lost freight access.
How CSA Points Are Actually Calculated
Most of the CSA points charts you will find online get one thing badly wrong, so it is worth seeing the real mechanism.
Every violation gets a severity weight from 1 to 10, where 1 is the lowest crash risk and 10 the highest. The full violation-by-violation list lives in Appendix A of the methodology, published as a spreadsheet (FMCSA, SMS Appendix A violation list).
The weights do not transfer between BASICs, and this is the part everyone gets wrong. FMCSA states it plainly: a 5 in one BASIC is not equivalent to a 5 in another, and severity weights from one BASIC "should not be added, subtracted, equated, or otherwise combined" with a weight from another. A 5 means the midpoint between 1 and 10 inside that one category. Any chart that gives you a single running points total across all seven categories is describing something that does not exist (FMCSA, SMS Methodology, BASIC Prioritization Status Version 3.21, June 2026).
Four more rules decide what a violation actually costs you.
- Out of service adds 2 to the severity weight, in the BASICs where OOS weights apply. They are not applied in Unsafe Driving, where most violations are not OOS conditions, nor in Controlled Substances and Alcohol, where most of them are.
- One inspection is capped at 30 severity points in any one BASIC, and the cap is applied before time weighting. A single catastrophic inspection cannot run away with your score.
- Time weight is 3, 2 or 1, by age, as above. Severity multiplied by time weight is what actually enters the measure.
- The measure is normalised, against driver inspections for the driver BASICs and vehicle inspections for the vehicle ones, then you are ranked against carriers in your own safety event group. That is why clean inspections help: they raise the denominator (FMCSA, SMS Methodology, BASIC Prioritization Status Version 3.21, June 2026).
So a severity 5 violation with an OOS order, recorded last month, in a BASIC where OOS weights apply, enters as (5 + 2) x 3, which is 21. The same violation eighteen months later enters as 7. In two years it is gone.
Crashes work on their own small scale rather than the 1 to 10 one.
| Crash type | Severity weight |
|---|---|
| Tow-away, no injury or fatality | 1 |
| Involves an injury or a fatality | 2 |
| Involves a hazmat release | the above, plus 1 |
A crash counts against you regardless of who caused it, with one exception. The Crash Preventability Determination Program lets you submit evidence that an eligible crash was not preventable, and a crash accepted under it is shown as "Reviewed, Not Preventable" and excluded from the Crash Indicator measure (FMCSA, SMS Methodology, BASIC Prioritization Status Version 3.21, June 2026).
How to Look Up Your CSA Score
A CSA score lookup costs nothing and takes a few minutes.
- Go to FMCSA's Safety Measurement System at ai.fmcsa.dot.gov/SMS.
- Search by USDOT number, or by carrier name if you do not have the number to hand.
- The public view shows your BASIC percentiles and the inspections behind them. To see your own full record, including the parts the public cannot, sign in with an FMCSA Portal account tied to your USDOT number.
Two categories are not public, and that cuts both ways. Crash Indicator and HM Compliance percentiles are withheld from the public view (FMCSA, SMS Methodology, BASIC Prioritization Status Version 3.21, June 2026). A broker screening you cannot see your crash percentile. Neither can you, until you log in, which is why carriers are regularly surprised by a crash record they never knew was being counted.
Drivers have a separate record. The Pre-Employment Screening Program report covers three years of your inspections and five years of reportable crashes, and you can request your own (Foley, 16 March 2026). A violation corrected in SMS does not automatically correct everywhere, so check both.
How to Bring the Number Down
Four things move a CSA score, and only one of them is fast.
Stop adding violations. Consistent pre-trips and a maintenance schedule are the whole of it. Vehicle Maintenance is the category most carriers bleed in, and it is the one most within your control.
Let the old ones age. A violation at time weight 3 today is at weight 1 in a year and gone in two. Doing nothing wrong for twelve months is itself a strategy, because the arithmetic works for you.
Keep taking clean inspections. The measure is a ratio. Clean inspections raise the denominator, so a carrier running steadily through scales with nothing found dilutes the violations it already has. Avoiding inspections does the opposite.
Dispute what is wrong. This is the fast one, and it is the only route that removes a violation rather than waiting it out. FMCSA rebuilt the process in September 2026, and it now carries three stages, deadlines on each, and a requirement that a denial explain itself. Challenges go through FMCSA's DataQs system.
The order matters. Disputing a violation that is genuinely yours wastes the hour it takes to file. Disputing one that is recorded against the wrong USDOT number, or against equipment that was not on the vehicle, is the single highest-return hour in compliance.
Compliance Keeps the Doors Open, Cash Lets You Walk Through
A clean score gets you onto the broker's approved list. It does not pay for the fuel on the load they offer you.
That is the part CFX handles. We check broker credit before advancing funds, so you know who you are hauling for, and we turn delivered invoices into working capital instead of a waiting game. Who carries the loss when a broker does not pay at all is a separate question, and it comes down to recourse against non-recourse. Factoring is the sale of an invoice you have already earned. It is not a loan, nothing is borrowed and nothing is repaid on a schedule, which is why the decision rests mainly on your customer's credit rather than yours.
What the wait is costing you per load is arithmetic, and what factoring costs is the other half of it.
So which one is actually holding you back right now, the record or the cash flow?
Frequently Asked Questions
What does CSA stand for in trucking? CSA stands for Compliance, Safety, Accountability. It is FMCSA's safety enforcement program, which collects roadside inspection and crash data and converts it into comparative safety scores for motor carriers.
What is a good CSA score? Lower is better. Scores are percentiles, so a result in the 20th percentile means 80 percent of comparable carriers have worse records than you. For a general freight carrier the intervention threshold is the 65th percentile in Unsafe Driving, Crash Indicator and Hours-of-Service Compliance, and the 80th in the other four categories. Hazmat and passenger carriers are held to stricter numbers (FMCSA, SMS Methodology, BASIC Prioritization Status Version 3.21, June 2026).
Which sources provide data for CSA? Roadside inspection reports from state enforcement agencies, state-reported crash records, FMCSA investigation findings from the past 12 months, and carrier census data from forms MCS-150 and MCS-151 used to normalise the measures (FMCSA, SMS Methodology, BASIC Prioritization Status Version 3.21, June 2026).
How long do CSA points stay with you? Safety events older than 24 months are no longer used to assess your safety posture. Before that their weight falls as they age, from triple in the first six months to double from six to twelve months and single from twelve to twenty-four, so scores improve on their own if no new violations are added (FMCSA, SMS Methodology, BASIC Prioritization Status Version 3.21, June 2026).
Does a written warning count against my CSA score? Yes. FMCSA is explicit that violations noted on the inspection form during a stop do not always result in a citation being issued to the driver, but are used in the SMS whether or not a citation is issued. A warning is not a free pass. Scoring runs on the violation recorded, not on whether you paid anything (FMCSA, SMS Methodology, BASIC Prioritization Status Version 3.21, June 2026).
Sources
FMCSA, SMS Appendix A, the full violation list with severity weights
Foley, "How Long Does a CSA Violation Stay on Record?", 16 March 2026